
In this blog, Ryan Stevens, Customer Experience Specialist at Esker, highlights the top 5 order management reports that could help to drive positive-sum growth in your organisation.
Numbers don’t lie, and reporting can be a powerful tool to gauge a performance of a business. I’ve always had a keen interest in numbers, and statistics are none too different. From my time reporting on statistically significant data at university, to assisting order management customers in reporting metrics, I have always understood that reporting metrics can divulge surprising information, which may not be clear at first glance.
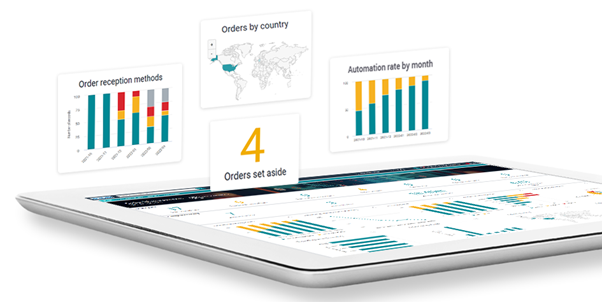
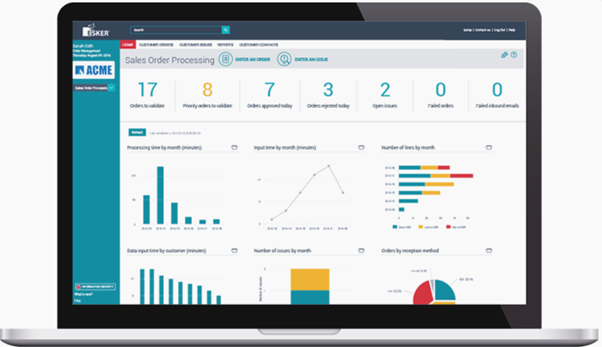
Without measuring key performance indicators (KPIs), a business will find it ever more challenging to grow and develop, and especially when trying to manage resources to specific areas of the business. Esker’s in-house reporting software has the capacity to report on several metrics related to an order. This could include, volume of orders by customer or country, data input time by customer, and average processing time per order.
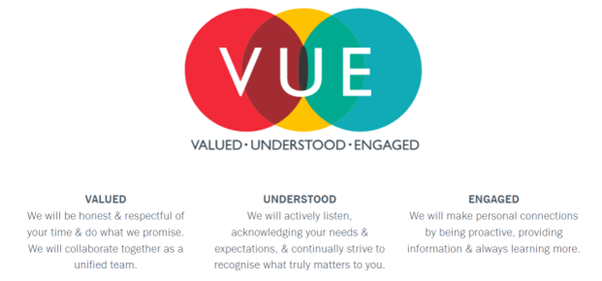
As a Customer Experience (CX) Team, we empower our Silver and Gold customers to utilise and customise Esker’s reporting software, enabling our customers to export their bespoke information, which can be scheduled regularly or reported within Esker’s dashboard. Our CX philosophy is ensuring our customers feel Valued, Understood and Engaged, and we take pride aiding our customers’ operations.
Here are five key metrics, which I would recommend to any Customer Service Manager:
1. Average processing time by customer.
From my experience with order management customers, after the implementation of Esker’s solution, our customers notice a significant decrease in order processing across the board. However, once the initial optimisation has been completed, the question to ask is; how can we push the solution further to reduce processing times and how can we do this with the ultimate goal to increase the capacity to process additional orders per Customer Sales Representative (CSRs)?
Looking at processing times by customer, allows the user to clearly identify vendors which are taking the CSR an additional amount of time to process. This will allow managers to put in additional resources to help reduce the time. This could include ensuring staff are capturing the correct data for auto learning to be correctly applied, or additional teaching rules to take place.
In some industries, for example medical and pharmaceuticals, many suppliers use similar purchase order templates, which could mean a fix to a specific supplier may positively affect other suppliers.
2. Service Level Agreements Compliance
Many companies will have custom service level agreements for their organisation. Esker’s Order Management Solution can collect data to calculate order processing time. Collected data also helps determine whether orders meet service level targets. These targets can be changed, and take into account time zones, staff starting times, lunch breaks, finishing times, and closures at the weekend. For example orders received 4pm (GMT) on a Saturday, which haven’t been processed until Monday, could potentially still meet a 1 day service level agreement.
The SLA compliance report, demonstrates the percentage (or number) of times an organisation has met, or not met, their SLA Agreement. This report can be filtered by sales organisation, country and date, to name but a few.
Depending on your specific filters, it could potentially highlight key issues within a business, either that a specific sales organisation are dealing with a high amount of traffic, a specific day of the week may be highlighted as a challenging day, or may highlight backloads within organisation, or areas where additional resources need to be implemented.
3. Number of changes by field.
Esker has different layers within its AI engine, including Synergy, first time recognition, auto-learning and teaching. What this report shows is the number of manual changes a CSR has made, by field name. This report can be easily customised to filter by supplier and/or a period of time. What we can extract from this report is certain issues with specific purchase orders which Esker has received. With some poor quality images like a scanned purchase order, the OCR engine may have trouble reading the text, resulting in the wrong field being extracted.
One thing to note with this report, is that Esker learns which correct fields to extract with each order approved (known as auto-learning). So with a new supplier, you might find that the solution picks up the wrong order number initially but with several manual changes within multiple orders, the Esker solution will narrow down the correct field to populate for the future.
4. Top-Selling Item
A simple report like this can show more than just what is selling most within a single period. You can customise the report, displaying multiple months and years to see how seasonal a specific item is. This could determine stock levels in the future, and potentially could be upsold with additional products.
Similar to other reports, we can look in detail between each large volume customer, to understand which items they are purchasing, and how this changes over a period of time.
This report can also ascertain when a product is reaching the end of its life-cycle, or when a more superior product has surpassed in sales.
5. Automatically processable orders by customer.
Within the Esker Order Management (OM) solution, customers have the ability to auto-process orders if required. Meaning that when an order is retrieved through the OM solution, it has the potential to be posted without human interaction, provided any preliminary checks have been successfully passed. This function can be switched on and off, but also can be switched on partly by the customer.
This particular report describes the amount of orders which have the potential of being auto-processed, without the order being auto-proceed or not. Different customers decide on their own if they want to auto-process order functionality, as many like to have some form of human interaction for each order approved. With many orders being auto-processed, CSRs can focus on more complex tasks within the organisation. Either way, getting to a position of auto-processed orders means orders can be approved without any manual changes from the CSR required.
For customers looking to utilise auto-processing, this report can identify customers which can benefit from auto-processing, while also highlighting orders which aren’t able to be auto-processed.
Overtime, customers which see an increase in auto-processable orders, will also notice a decrease in average processing times, due to the reduced amount of human input necessary.
To sum up, OM metrics are business critical operations, which can have a huge impact on how to allocate resources, and to manage customer orders more effectively. A cloud-based solution like Esker can manage, automate and analyse supplier orders, which can be complimented with other modules within Esker’s O2C solutions, such as Cash Application and Collections Management. For more information, contact us today.